Renewable Siting & Grid Connection
From Renewable Site Selection
to Substation Connection and Build Cost
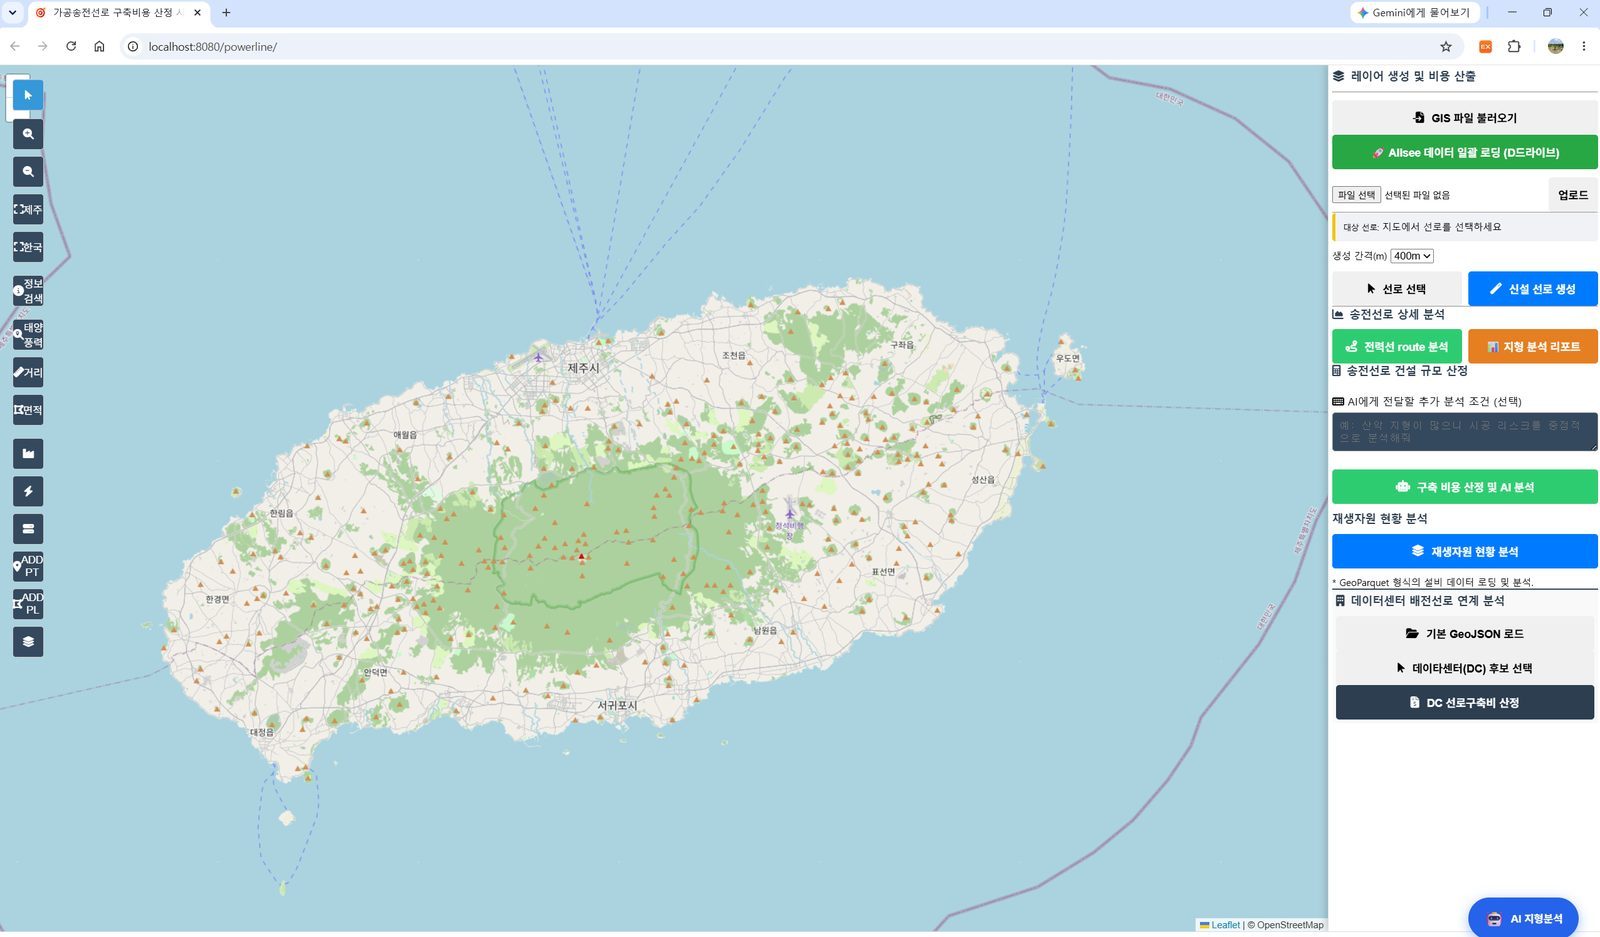
Grid engineers get precise interconnection and cost reviews; first-time users and investors can check site feasibility just by asking the AI. It runs on a local LLM, so no data leaves your environment.
For Everyone
Experts and First-Timers, on the Same Screen
We support both rigorous reviews by grid experts and simple Q&A for first-time users and investors.
Grid Engineers
The same manual reviews you do in the field — much faster. Automatic recommendations for site-to-substation interconnection and spare capacity, tower layout, 3D terrain and build-cost estimates, plus permitting and legal review per route.
First-Time Users & Investors
No jargon or drawings needed. Pick a region to get a resource map summary, ask the AI assistant in plain language for candidate scores, and share the report right away.
Workflow
How Route Review Changes
What used to mean gathering data across departments and systems now happens step by step on one screen.
Pick a Substation
Select an existing substation or create a virtual candidate for a new one.
Draw the Route
Draw the expected corridor directly on the map.
Auto Tower Layout
Towers and lines are generated automatically at the chosen spacing.
Terrain & Regulation Analysis
GIS overlay queries and AI regulatory review run together.
Cost Report
Material needs and rough construction cost are compiled into a report.
Auto Tower Layout
Towers Are Placed Automatically
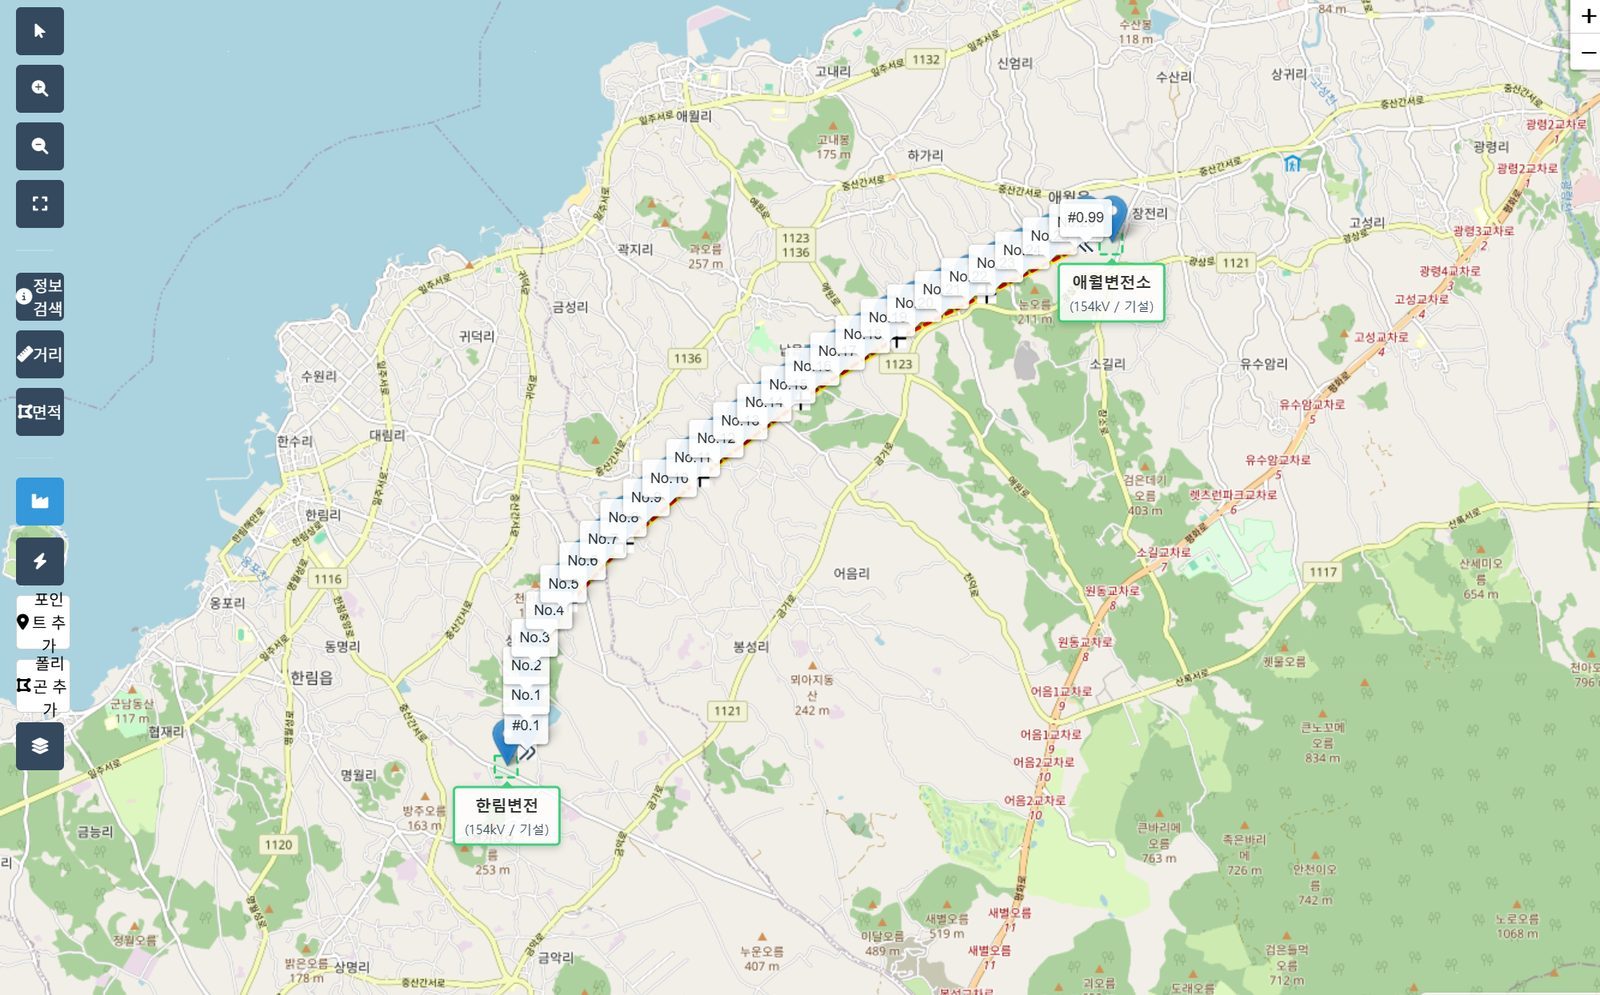
Draw a provisional line and towers are placed at 400 m, 450 m or 500 m spacing, lines are connected between them, and nearby forests, buildings, rivers and earthquake, wildfire and typhoon-prone areas are identified.
Terrain Profile
Span Data Becomes Design Input
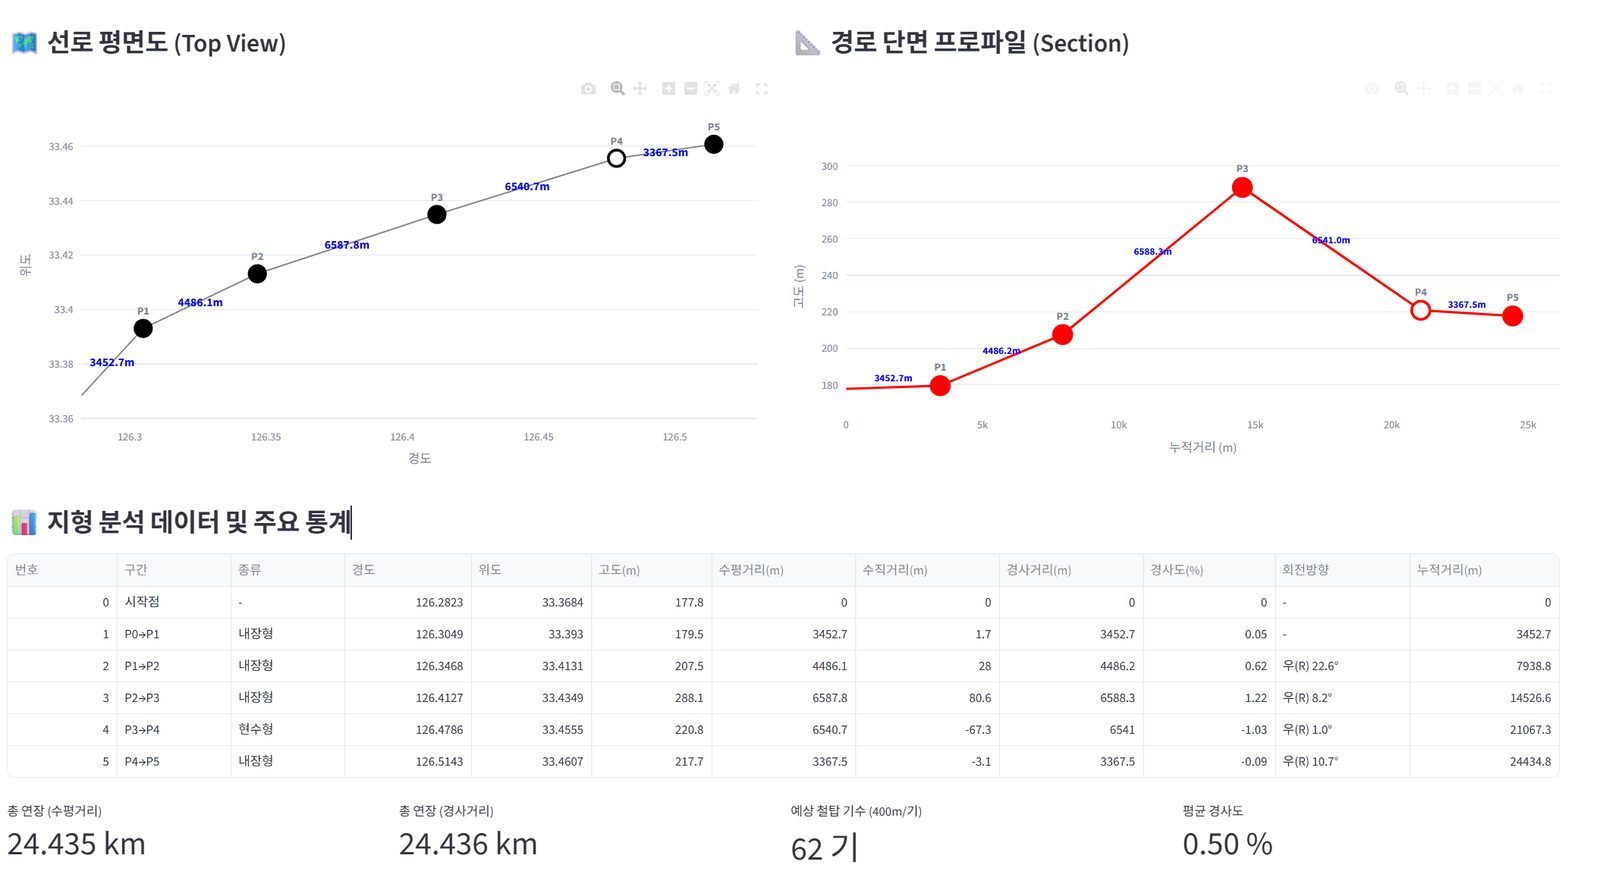
We generate plan views and longitudinal profiles and calculate slope and turning angle per span. The angle determines the tower type (suspension / light-angle / medium-angle / dead-end), which in turn drives steel weight and construction cost.
National Grid
See National Infrastructure Too
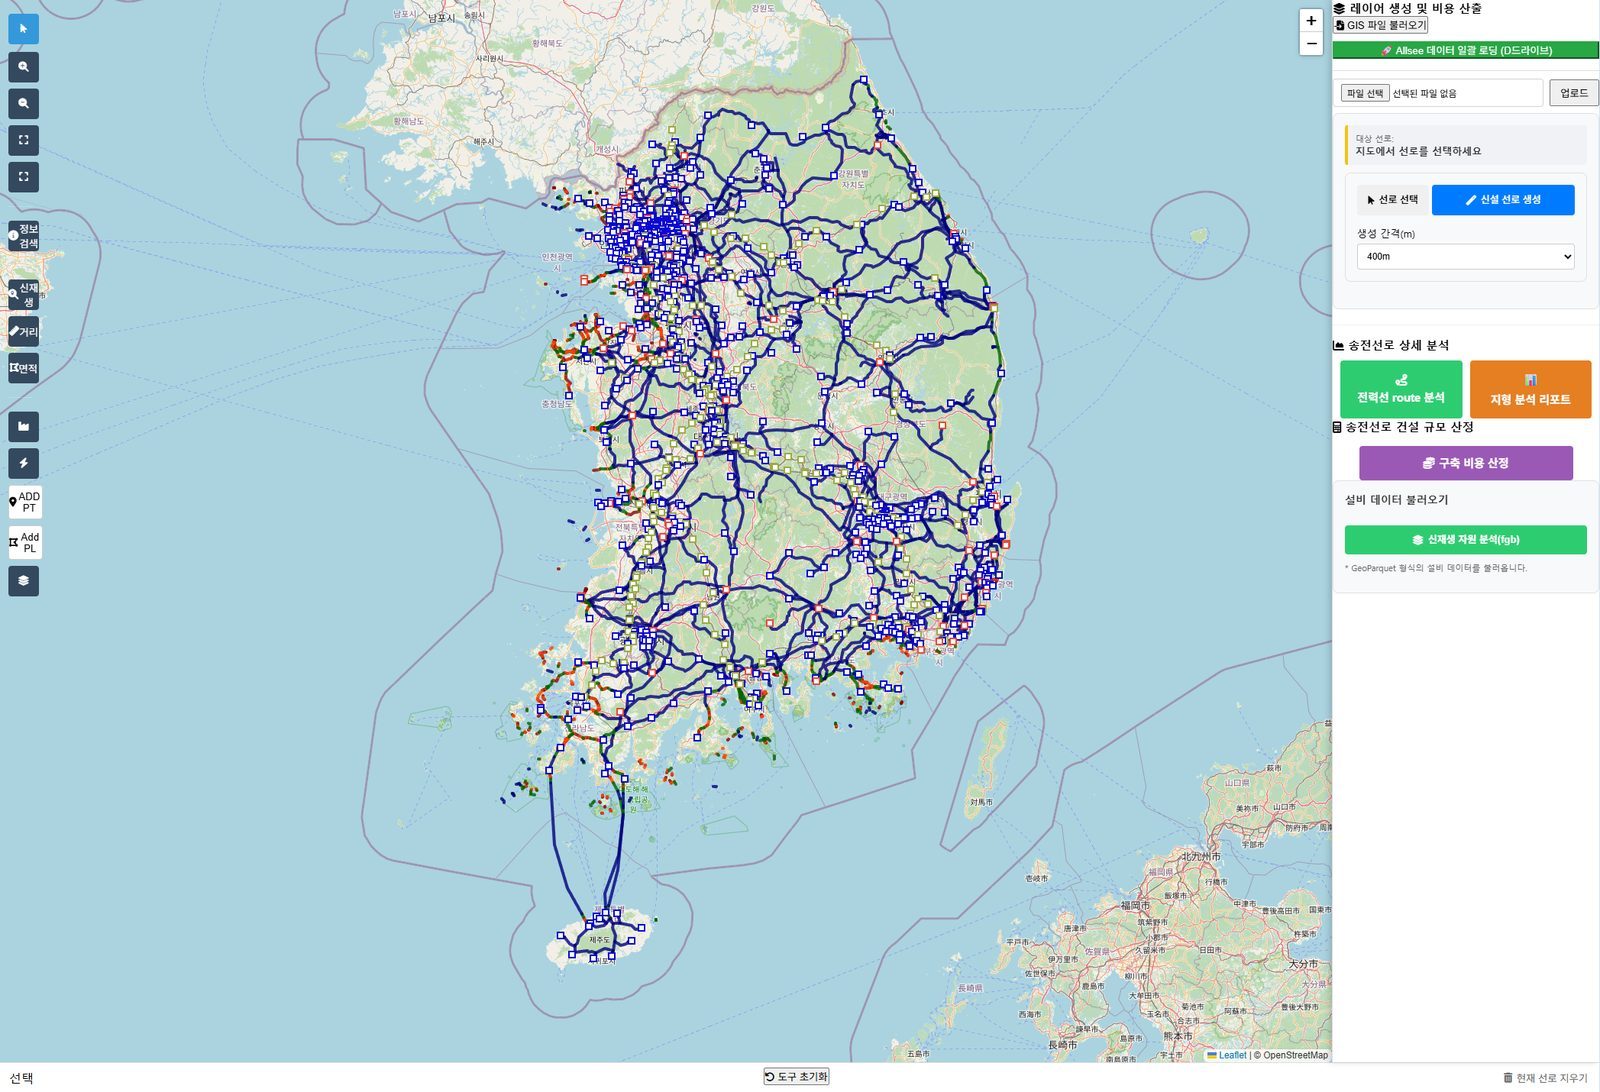
Go beyond a single route: browse substations, transmission lines and renewables nationwide, then drill down per substation.
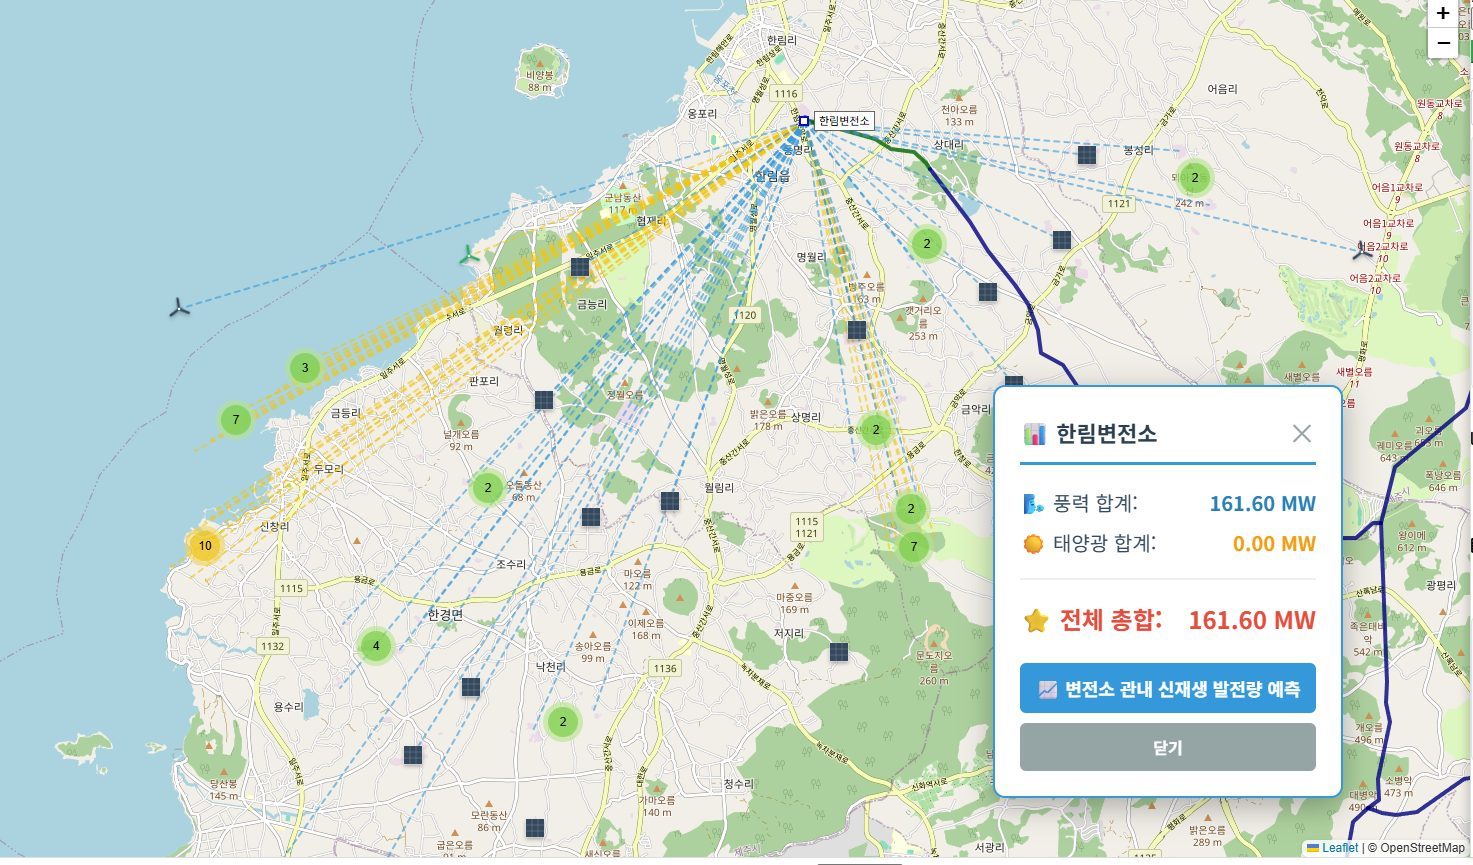
Renewable Siting
Renewable Analysis Has Two Pillars
Site analysis that evaluates one candidate in depth, and a resource map that scans the whole area.

Renewable Siting
Check solar and wind resource and expected output at a site, then score its suitability.
- Long-term resource averages and output forecast for a point
- Suitability score from terrain and land cover
- Cadastral-based candidate screening (Korea)

Renewable Resource Map
Browse and overlay renewable-related geospatial layers on a single map.
- Generation assets by source, with a capacity filter
- Solar and wind rasters overlaid with voltage-graded transmission lines
- Click a plant or substation for its details
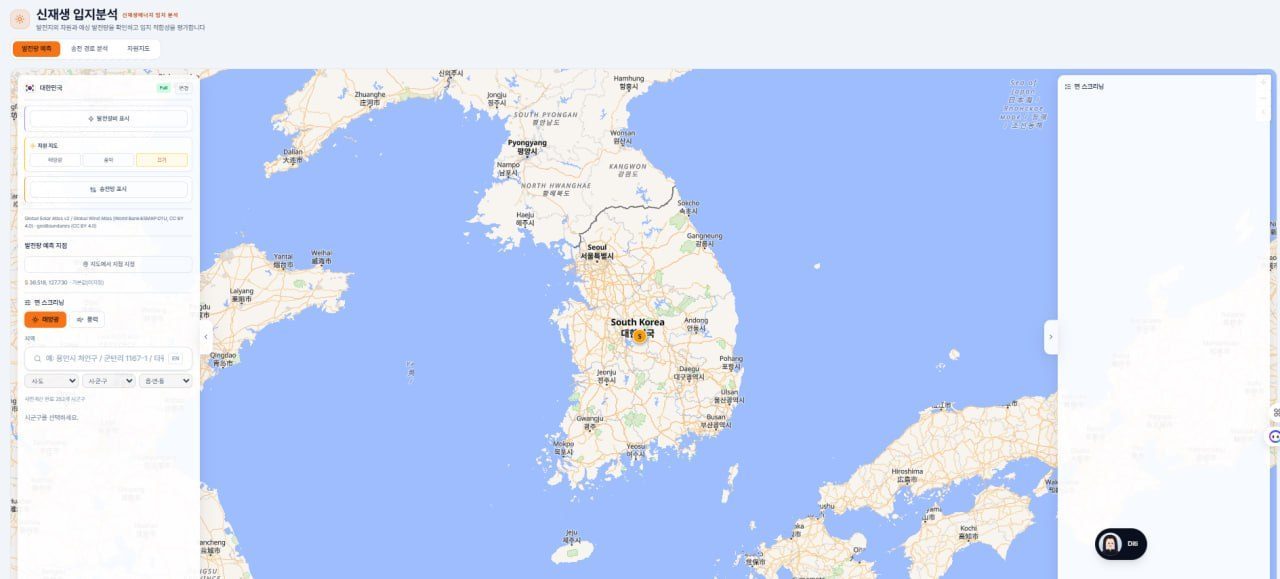
01 · Forecast
Power Forecast
Click a point on the map or narrow down by district to see the resource level and expected output there. The method switches between irradiance-based and wind-speed-based depending on the source, and screening scans a whole area to pick sites that meet your conditions.
- Pick on the map — coordinates or province–city–district
- Switch solar · wind
- Screen candidate sites across the map
02 · Grid Route
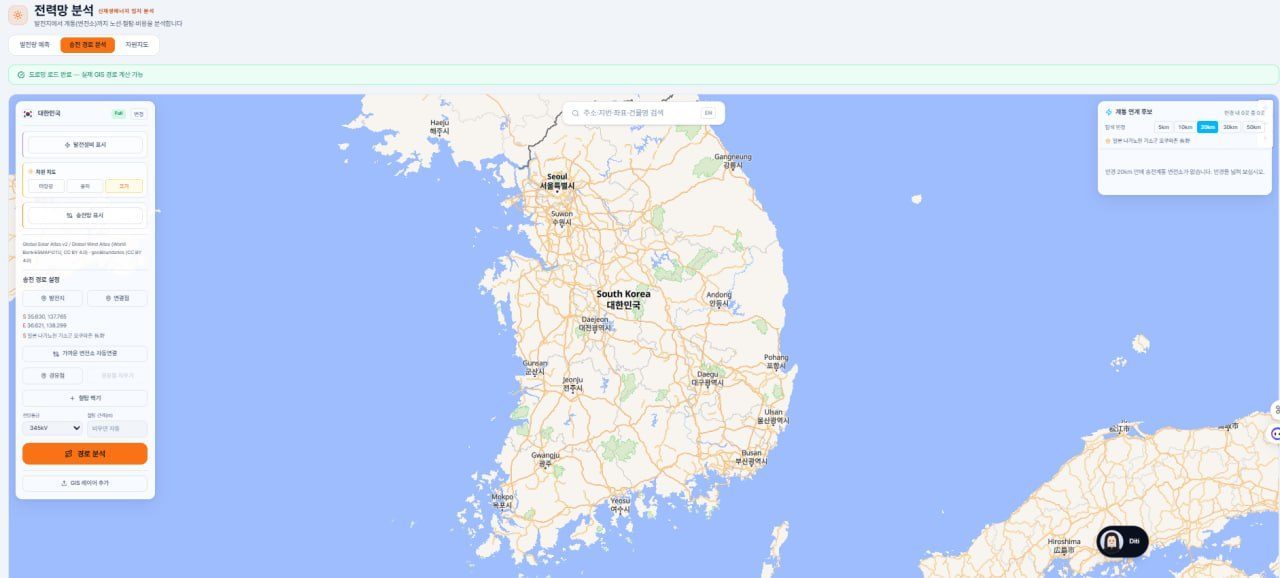
Grid Route Analysis — From Plant to Grid
We analyze route and tower costs from the plant to the grid (substation). Real road networks are loaded to compute GIS-based paths, and nearby substations are searched within 5, 10, 20, 30 and 50 km.
- Set plant and substation coordinates (nearest substation auto-selected)
- Add waypoints and place towers
- Choose voltage class (e.g., 345 kV) · tower spacing calculated automatically
- Add your own GIS layers
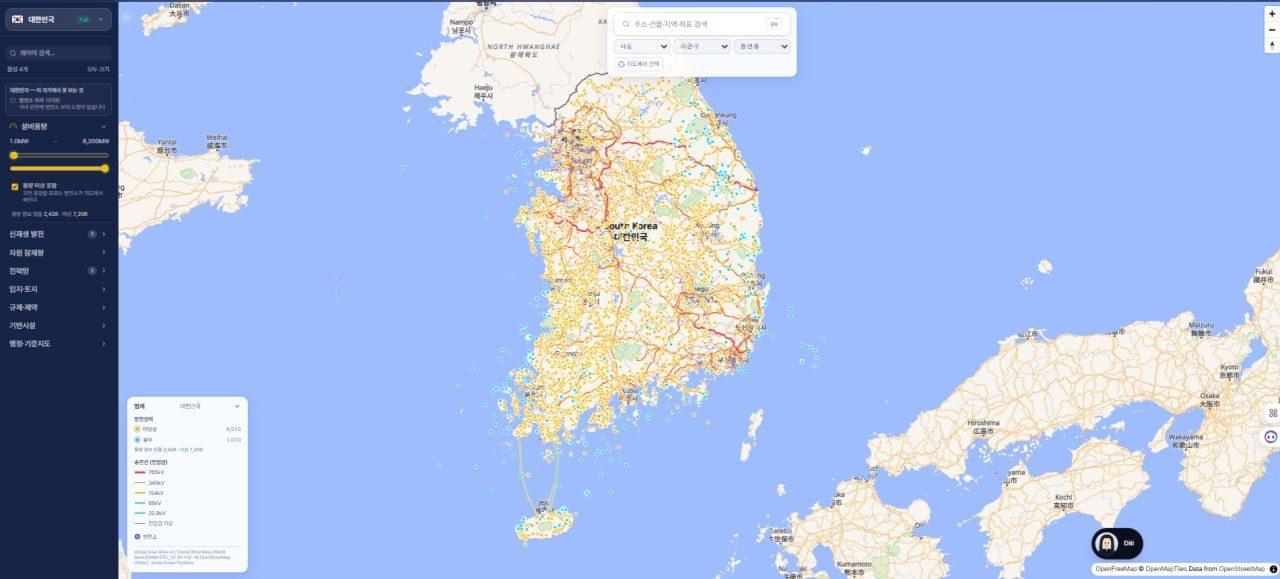
03 · Resource Map
Resource Map — Overlay Geospatial Layers
Turn on only the layers you need from 7 categories of geospatial data.
Solar and wind asset locations and capacity
Irradiance and wind-speed rasters
Transmission lines and substations by voltage
Cadastral map and land use
Restricted and protected zones
Roads, railways and access facilities
Administrative boundaries and base maps
Slider from 1.0 MW to 8,200 MW
Data sources — Global Solar Atlas v2 / Global Wind Atlas (World Bank · ESMAP · DTU, CC BY 4.0), OpenStreetMap · OpenMapTiles (ODbL), Korean power facility records.
Data Center
We Review Data Center Grid Access Too
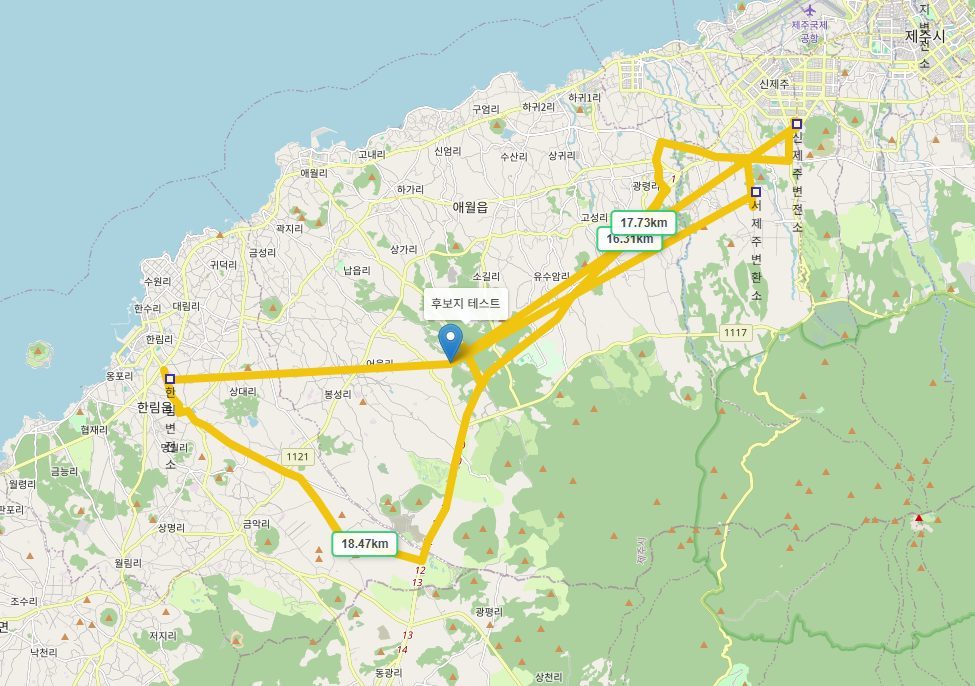
Enter a data center candidate site and up to 3 nearby substations are selected automatically. Shortest and road-following paths are explored together, and build costs are compared with weights for overhead, underground and crossing sections.
Process
How a Renewable Project Review Flows
From resource check to legal review and reporting — without a break.
Check the Resource
Check long-term irradiance and wind averages to gauge the resource first.
Assess Suitability
Overlay terrain, land cover and regulations to score whether a site is actually buildable.
Find Grid Connections
Search for connectable substations by radius to confirm feasibility.
Estimate Connection Cost
Draw the route from plant to substation and calculate tower layout and cost.
Legal Review & Report
The AI engine reviews relevant laws and compiles the results into a PDF report.
Grid
Public power site
Towers, substations, power plants
Demand
Power demand site
Data centers, semiconductor fabs
Commercial
Retail site
Small business locations
Support
Support facility site
Reservoirs, dams, etc.
Reviewing a Candidate Site?
Share real coordinates and we’ll demo everything from resource analysis to grid connection. We’re also recruiting pilot users, investors and partners.
Inquire About Pilot & Investment